Build pretty box plots fast
ppp_boxplot.RdA function to produce box plots using ggplot2 with theme, colors, and statistics
Arguments
- data
data frame containing the variables to be plotted and analyzed
- x_var
categorical variable in the data frame that will be used for grouping on the x-axis
- y_var
numeric variable in the data frame that will be plotted on the y-axis
- comparisons
list specifying the pairs of categories in x_var to be compared statistically
- colors
character vector of color names, where the number of colors provided must match the number of unique categories in the x_var variable
- method
statistical method used for comparing the groups specified in comparisons (e.g., "wilcox.test", "t.test")
Value
visually appealing, colored box plot of y_var grouped by x_var, with statistical comparisons of the specified groups (comparisons) displayed on the plot, using the specified method. The plot is customized with colors from the provided colors vector
Examples
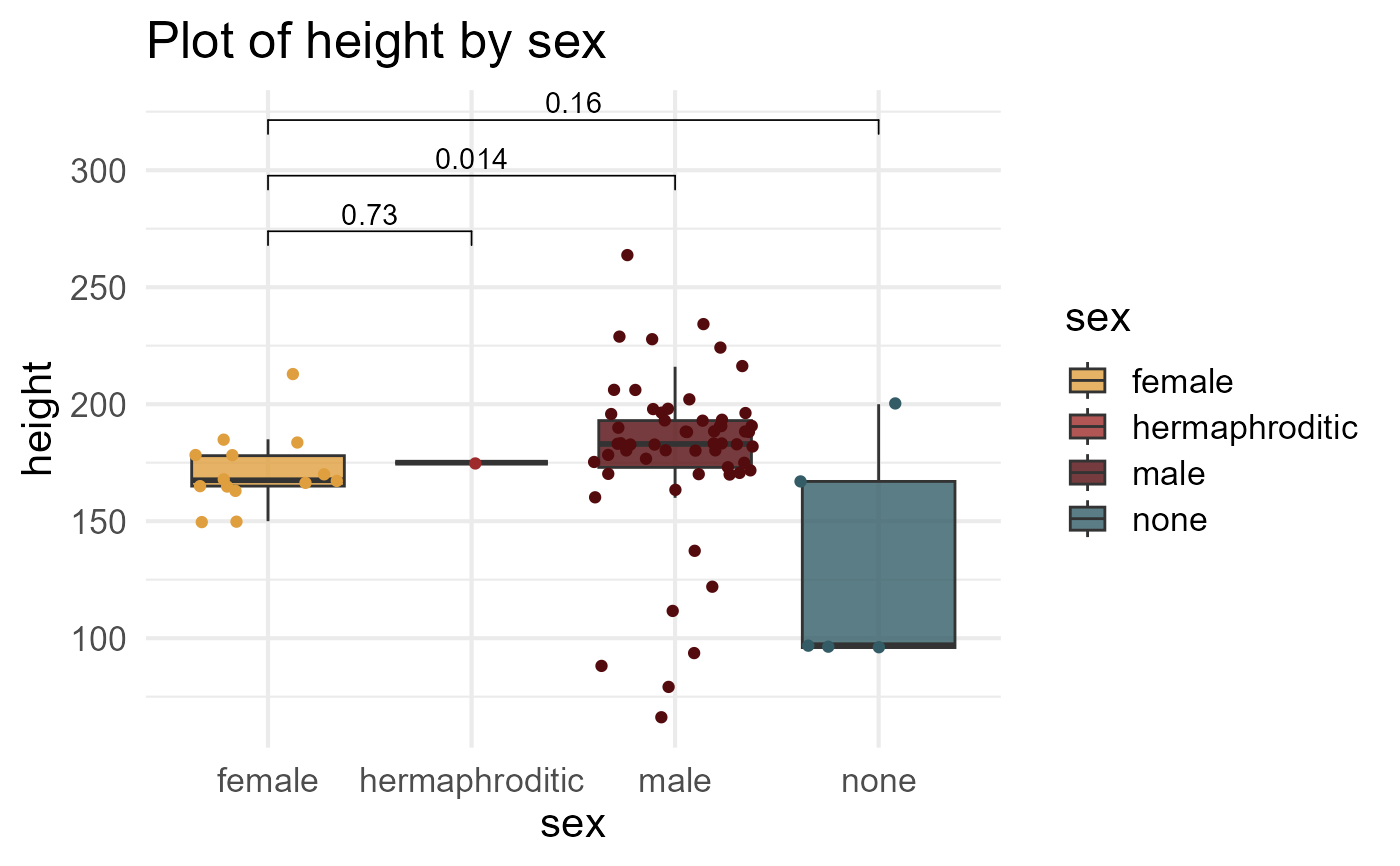
my_comparisons <- list(c("female", "hermaphroditic"), c("female", "male"), c("female", "none"))
my_colors <- c("#E09F3E", "#9E2A2B", "#540B0E", "#335C67")
my_method <- "wilcox.test"
ppp_boxplot(data = dplyr::starwars,
x_var = "sex",
y_var = "height",
comparisons = my_comparisons,
colors = my_colors,
method = my_method)
#> Warning: Removed 6 rows containing non-finite outside the scale range
#> (`stat_boxplot()`).
#> Warning: Removed 6 rows containing non-finite outside the scale range (`stat_signif()`).
#> Warning: cannot compute exact p-value with ties
#> Warning: cannot compute exact p-value with ties
#> Warning: Removed 6 rows containing missing values or values outside the scale range
#> (`geom_point()`).
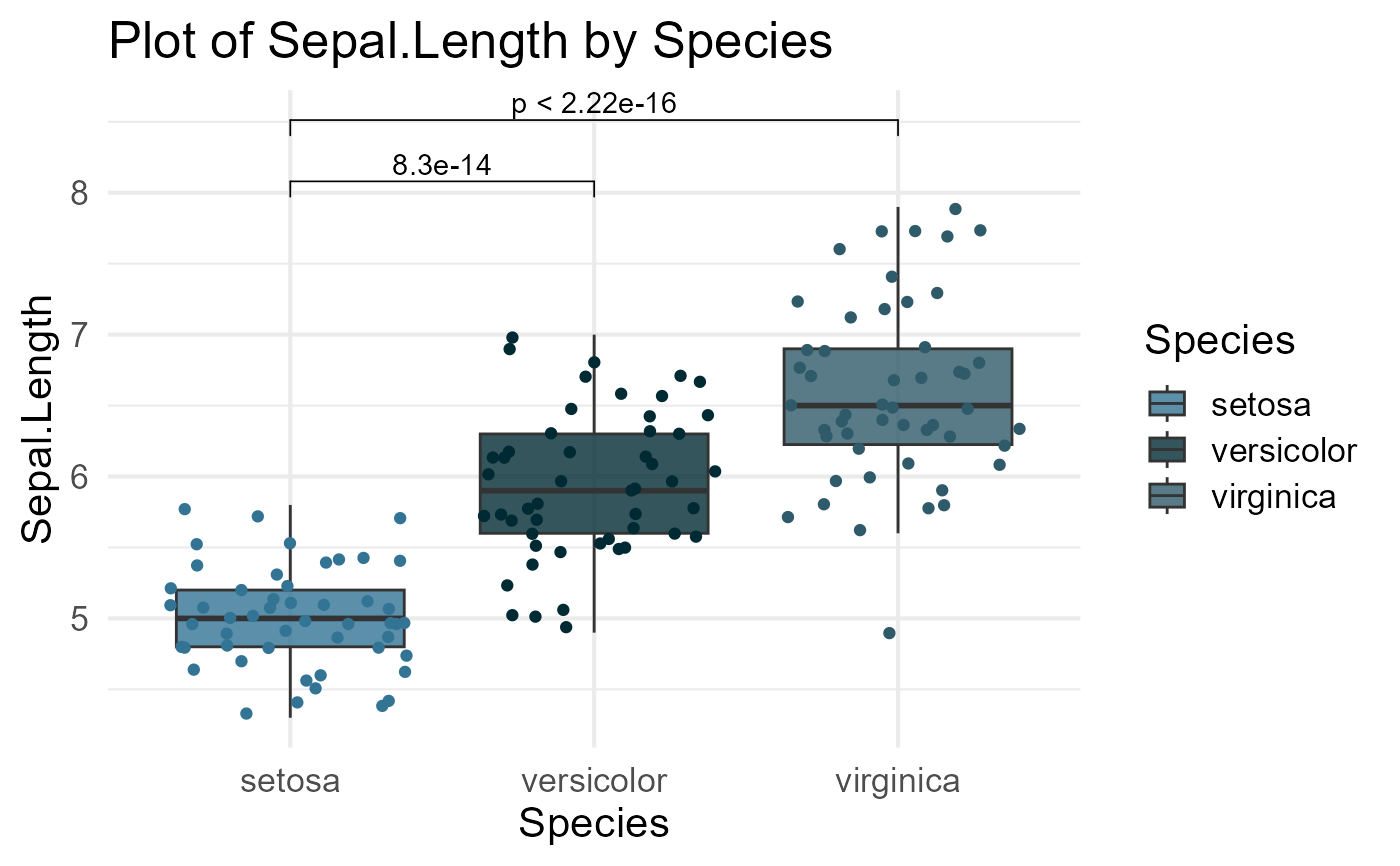
 ppp_boxplot(data = iris,
x_var = "Species",
y_var = "Sepal.Length",
comparisons = list(c("setosa", "versicolor"), c("setosa", "virginica")),
colors = c("#337495", "#002a33", "#2f5a69"),
method = "wilcox.test")
ppp_boxplot(data = iris,
x_var = "Species",
y_var = "Sepal.Length",
comparisons = list(c("setosa", "versicolor"), c("setosa", "virginica")),
colors = c("#337495", "#002a33", "#2f5a69"),
method = "wilcox.test")